The past fiscal year has sailed across some of the most tumultuous seas the banking industry has seen since the 2008 financial crisis. The US experienced its second and third largest bank failures ever within just days of each other.
As the world turns increasingly towards these fully digitized banking experiences, fraudsters aren’t wasting time hanging around the legacy brick-and-mortar businesses with scams and hope. Rather, they’ve adopted digital lockpicks to crack all the new electronic locks. These locks appear when accessing, buying, and exchanging money online, and criminals are always developing new ways to go about circumventing them.

In addition, the threats these criminals pose to the larger payment ecosystem mean that regulators are monitoring the whole banking system with a fine-toothed digital comb, regardless of whether the bank has updated its business channels to digital. Fintechs and banks are often spending more on compliance than they are losing to the fraud itself. This is likely due to the increasing costs of customer due diligence (CDD), in addition to abiding by regulations and avoiding massive fines.
From today’s pervasive banking fraud trends to the specific methods, locations, and actors that get employed – as well as the overall impact that fraud has on the face of the banking sector – SEON has compiled a comprehensive index of today’s fraud pain points and solutions. Though most data sourced refers to UK and US sources, compliance with these regulatory frameworks applies to most jurisdictions, especially those maintaining business operations or relationships in those regions.
Banking Fraud Trends 2023
In terms of the sea of changes the banking world is experiencing, the shift towards digitization is certainly the most important when it comes to predicting fraud patterns. When banks and money services cast this much larger net over a previously underbanked population and normalize a purely digital experience in doing so, they create new attack vectors for fraudsters, as well as new techniques to exploit.
Holistically, those new vectors and techniques can be characterized as either:
- Fraudsters fully submerging themselves in the digital
- Fraudsters fully committing to the analog
Exemplifying these two angles of attack, JP Morgan’s annual payments fraud survey showed that, on the digital side, card-related fraud types rose by an alarming 10% over 2022, with businesses overall showing lower volumes of digital fraud. However, those attacks ultimately got away with more money.

Meanwhile, on the analog side, the report shows that the volume of business email-related attacks that targeted poor awareness training and process management was on an obvious rise, with 71% of fintechs reporting they had a BEC breach in the past year. Also prevalent was authorized push payment (APP) fraud, accounting for 40% of fraud losses over 2022 in the UK, according to PSR’s latest APP fraud performance report. We’ll take a more granular look at the pervasive threats below.
The banking sector has also faced particular shakeups in terms of consumer confidence. The recent failures of Silicon Valley Bank and Signature Bank, as well as Credit Suisse, one of the international banks considered “too big to fail,” has caused ripple effects that are still threatening smaller business now.
Meanwhile, in 2022, the financial impact of the Russia-Ukraine war forced the US Federal Reserve to adjust interest rates seven times to control mounting inflation.
At an individual level, these factors inevitably push citizens to look for alternative streams of income to meet the rising cost of living. Money laundering and phishing are increasingly facilitated by both witting and unwitting citizens who, in times of financial downturn, are more willing to commit to ignorance when offered lucrative, if suspicious, opportunities to make money. Hence, money mules are an impactful issue for financial institutions wanting to steer clear of money laundering noncompliance fines.
Additionally, the recent turmoil in the financial sector – particularly as huge scandals like the collapse of FTX still have ramifications in the economic landscape – has caused regulators to increase scrutiny on financial institutions. Oxford Economics published a report this year quantifying that the spending on compliance in financial institutions outpaces the actual loss to fincrime itself, with this spending anticipated to increase through 2025.
Even at this macro level, the seas are obviously stormy. Businesses being mindful of their return on investment (ROI) will address the emerging issues individually, as each has the potential to steer businesses’ growth plans off-course.
Key Findings
In terms of the raw data from surveyed financial services, the most notable outliers revolve around:
- the prevalence of business email compromise as a huge security flaw
- the rise of neobanks and other digital banking platforms
- the increase in social engineering scams that lead to BEC and APP fraud
- the expense of anti-money laundering (AML) compliance and the understandably large number of institutions still on the path to meeting it
- the continuing problem of flawed account opening processes
- the unique identity validation challenges offered by Buy Now Pay Later (BNPL)
Data found in this index’s images were sourced from ACI Worldwide’s Prime Time for Real Time report, Cutting the Costs of AML Compliance published by LexisNexis, Neobanks: The Bumpy Road to Profitability from Aite-Novarica, and the 2023 AFP Payments Fraud and Control Survey Report underwritten by JP Morgan and executed by the Association for Financial Professionals. Additional statistics came from The World Economic Forum, Retail Banker International, and Oxford Economics. Data was compiled by SEON, informed by our own fraud analysis.
What Kinds of Fraud Are on the Rise in 2023?
As mentioned previously, pervasive banking fraud threats that did quantifiable damage to bottom lines can be thought of in two ways: the low-tech and the high-tech. In reality, successful scams often involve a mixture of the two.
Notably, 2023 sees medium-tech fraud exploits, such as bot attacks, becoming more approachable for fraud teams. These attacks, which execute credential stuffing or rapid transactions, are becoming easier to detect as fraud technology becomes more advanced. The statistics suggest that companies are also finally getting around to implementing those solutions, with 45% of all US financial services reporting they had fully integrated digital fraud prevention solutions in 2022, up from 28% in 2020.

Low-Tech Fraud 2023
As the standard for state-of-the-art fraud prevention measures goes up, fraudsters are hardly being discouraged from crime; instead, they’re looking for new channels with fewer safeguards. Low-tech scams – those that rely on con artistry, scams, and phishing techniques – are on the rise, and the resulting BEC and APP fraud can be damaging beyond simple revenue flow.
Business Email Compromise (BEC)
Though broadly referred to as email compromises, BEC can come in many mediums, but the end result is work-related login credentials being exposed and exploited. Depending on the level of access granted to a criminal with those credentials, the worst-case scenarios could all become realities: sensitive data leaks, misappropriation of funds, and snowballing phishing with high-level email addresses. CEO fraud seems to be mostly a buzzword rather than a massive threat, according to the data, but its existence as a term at least suggests that even executives are being targeted, sometimes with success.

Failure to implement robust training and awareness programs internally can cost banks and other fintechs immense amounts of revenue, reputational damage, and fines. These training programs should be looking beyond the most common faces that BEC fraudsters wear, and seeking to instill a reasonable amount of skepticism when navigating through comms channels, be they email, social media, websites, or even search queries. Note that high-level BEC may be more likely to be personalized by the fraudster for a higher success rate. As the data suggests, fraudsters seem to be spending more time crafting individual attacks, resulting in a lower number of overall fraud instances that ultimately get away with more money.
Authorized Push Payment (APP) Fraud via Phishing
Banks and money services have to contend with essentially the same issue on the other side of the digital teller window. Authorized push payments are payments made from a customer account, which, from the institution’s perspective, are authorized by merit of having the correct security details. They are more common in ecommerce when it comes to unauthorized purchases, but when they occur in banks, the fact that only money is moving can cause even greater fallout for the institution due to the regulations the vertical must adhere to. Real-time payment services such as Pix are compounding these problems by merit of the small timeframe in which to catch the criminal and the low friction of those services.
In general, APP fraud is harder to catch, as the fraudster will have the correct username and password combination. It is, however, imperative to guardrail ROI, as US lenders reported that 75% of all fraud losses were related to consumer phishing, with other financial services reporting those cases at 66%. PSR’s latest APP fraud performance report based on data from the 14 largest banking groups in the UK shows that banks refunded up to 91% of the total value of APP losses in 2022.
The increased digitization of the overall banking landscape can make these phishing attempts harder to spot. If your bank is purely digital, it seems more reasonable to trust an official-sounding email, phone call, or SMS that requests information. Similarly to BEC, these scams must be fought on the ground, with educational information built into the app or website.
High-Tech Fraud 2023
While some fraudsters take to the ground level to scam away their illicit money, others choose to fly over the technology. More fintechs and banks are doing a better job of not only implementing but also investing resources into better fraud detection software.
SEON’s own data found that scaled fraudsters hit a ceiling when attempting to circumvent modern fraud prevention tools. At a certain point, it is no longer cost- or time-effective for a fraudster to invest the time and energy needed to beat solutions like SEON that employ device fingerprinting and password hash scrutiny, at least at scale.
Similarly, legacy digital security implementations like one-time passwords or two-factor authentication sent over SMS were previously seen as foolproof. Then they were just “good enough”. Now, though, they’re looking positively outdated, with some independent security analysts now downgrading banks that rely on those methods that have been proven fallible in the face of highly sophisticated ploys like SIM swapping and man-in-the-middle (MitM) attacks.
Fraudsters not willing to take to the streets to carry out their crimes have to find a way to get themselves over these hurdles in order to pick the best, highest-hanging fruits.
Fraud-as-a-Service (FaaS)
Just as business models worldwide incorporate software-as-a-service (SaaS) platforms like SEON to fill out their workflows with robust solutions, fraudsters have also evolved to integrate purchasable fraud “solutions” bought online. These services can include snippets of code that execute credential stuffing and other bot-driven attacks, whole executable fraud packages, end-to-end phishing ploys that spoof website portals, and internal programs that organize stolen login credentials.
The accessibility of these services certainly informs the face of modern fraud, particularly those executed by individual users over a mobile device.
The Unique Challenge of Buy Now Pay Later Fraud
The success of Buy Now Pay Later (BNPL) across ecommerce channels has inevitably led to the microlending model being accepted by banks for various transactions. As of July 2022, more than two-thirds of US banks and credit lenders either accepted BNPL transactions or planned to within the next 18 months.
BNPL offers customers a unique way of democratizing financing and spending, but it comes with a unique set of challenges. These challenges will surely scale in the coming years, as Apple and Mastercard are currently rolling out their own BNPL products: Apple Pay Later and Mastercard Installments.
Compared to other regulated lenders, BNPLs and other real-time payment providers are less likely to introduce friction that would lead to even a single road bump in the customer journey to checkout – about 20% more BNPL lenders reported that they were “extremely focused” on optimizing risk in the customer journey than other financial services. Accordingly, partnering banks report that common methods of fraud prevention are harder to implement, as BNPLs may be able to provide less transactional data with which to assess risk. Also, compliance strictness may be lacking, both exposing the bank to its own compliance issues and damaging the ability to assess risk when the lenders loosen risk thresholds to cut down on false positives.

Costs of Fraud
The number of monthly fraud attacks on banks earning more than $10 million in annual revenue has shown a consistent increase year-on-year. In 2022, all US retail services, including banks, saw a 4.2% uptick in the overall cost of fraud per dollar. Fraud losses across bank payments totaled nearly $1.6 billion during that time.

Every $1 of fraud costs the US financial services $4.23, Canadian $3.78. These fees are inclusive of the legal, processing, investigation, and recovery expenses.
The channels through which these fraud costs rolled in are a reflection of the changing market. According to LexisNexis’ 2022 True Cost of Fraud Study for Financial Services, US-based financial and lending services saw outsized increases in the proportion of mobile banking fraud among all fraud costs. Respectively, financial institutions and lenders, including BNPL providers, reported that mobile fraud accounted for 32% and 37% of all fraud, representing upticks of 5% and 12% from the previous year.
Unfortunately, there is also a negative correlation between the diversity of fraud methods and the overall cost of fraud. Financial services providers in the US, including banks, investment firms, mortgage firms, and lenders, see fraud costs vary from between $2.92 per dollar to $4.81 as the variety of scams increases. Companies beset by BNPL fraud, automated bots, and BEC will have to output significantly more than those that do their utmost to close specific security gaps.
Costs of Compliance
In the UK this year, the money that regulated companies will spend on compliance alone will cost about three-quarters of the country’s entire defense budget. As mentioned before, the driving force behind this massive undertaking is not necessarily just to stop money laundering and fincrime but simply to abide by regulations. Similarly, the costs associated with compliance are more often justified internally with the increased AML scrutiny, rather than the need for more rigorous AML checks.

Similarly, the costs associated with compliance are more often justified internally with the increased AML scrutiny, rather than the need for more rigorous AML checks.
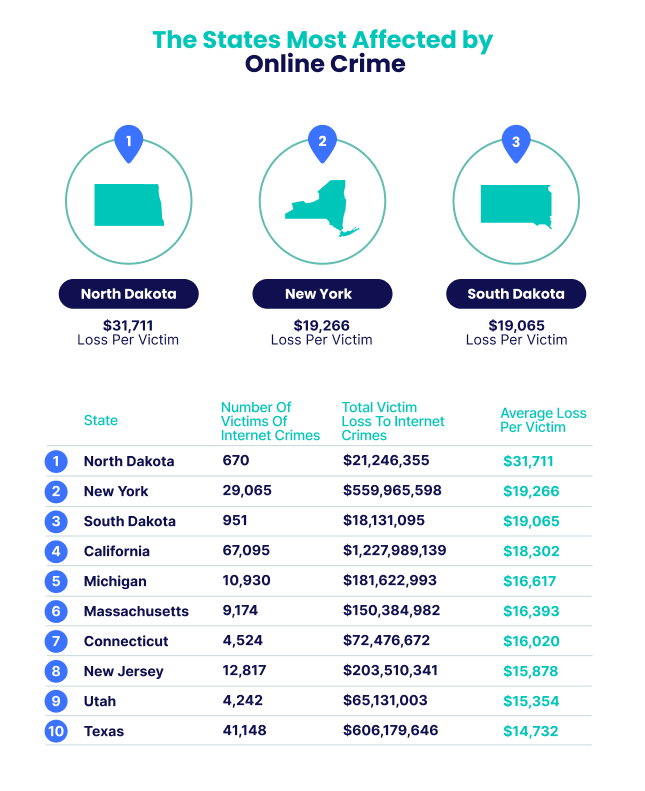
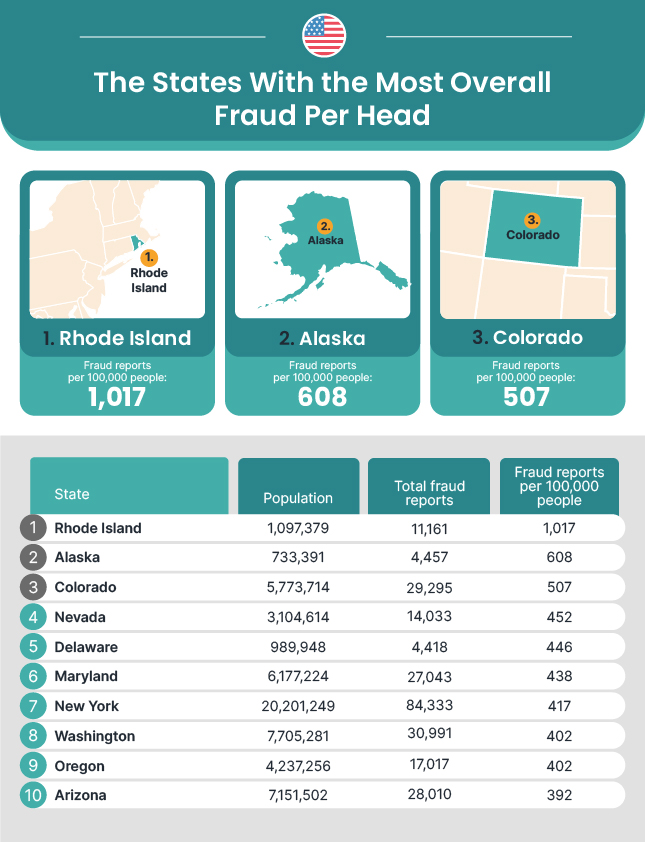
Which US States Experience the Most Fraud?
As with international compliance costs, fraud and fraud-fighting enforcement can vary from region to region, and in the US, state to state.
The Most Common Types of Banking Fraud in the UK

Check, Plastic, Card and Bank Account: 336,707 reports
Check, plastic, card, and bank account fraud made up the largest proportion of total reports in 2021 in the UK – a whopping 336,707 cases, equating to 38.45% of all reports.
Online Shopping and Auctions Fraud: 103,254 reports
The second most common fraud was online shopping and auction fraud, accounting for 11.79% of all fraud cases in the UK in 2021.
Application Fraud (excluding mortgages): 91,593 reports
Application fraud saw over 91,000 reports in 2021 in the UK, and this is excluding mortgage fraud.
The Most Costly Types of Banking Fraud in the UK

Other Financial Investment: £318m/$381m lost to fraud
Financial investment fraud was the most damaging in the UK in 2021. A whopping £318/$381 million was lost in the UK through this type of fraud.
Check, Plastic Card, and Online Bank Accounts: £184m/$221m lost to fraud
Check, plastic card, and online bank accounts – the most common type of fraud seen in the UK – saw UK citizens, organizations, and banks lose a total of £184/$221 million over 2021.
Share Sales or Boiler Room Fraud: £171m/$205m lost to fraud
Share sales or “boiler room” fraud, also known as call center fraud, cost the UK £171/$205 million in 2021.
How to Avoid Banking Fraud: The Best Fraud Prevention and Detection Features
Though it has always been a good idea for best practice fraud prevention, now more than ever, the need to scrutinize digital identity markers is paramount for robust cybersecurity.
Fraud pain points commonly reported by banks and financial services in the past year can be largely addressed by implementing the following measures:
- a multi-layered approach that offers risk assessment across multiple channels and with different strategies
- identity validation that pushes technological data points such as device fingerprinting and browser hashing
- distribution of security touchpoints not only to safeguard the process of account creation but also to protect endpoints and monitor mid-journey behavior with biometrics and velocity checks
- an AML tool to help teams both maintain compliance and detect sanctioned entities
Create Layers of Protection
Complete digital footprint analysis at onboarding easily blocks customers who attempt to use stolen, synthetic, or fake identities, including fraudsters armed with legitimate personal credentials stolen via phishing scams. In the face of threats like APP fraud or BEC, however, this is obviously not enough, as these kinds of scams will be exploiting accounts that have gone past the onboarding stage. Allowing fraud prevention software to create touchpoints at different stages across the customer experience will allow fraud teams a better win rate when it comes to preventing costly phishing scams from turning into huge reputational and regulatory damage.
Monitor Device Risk
As more customers turn to mobile apps like Pix for their financial services, businesses should be increasingly leaning on device fingerprinting to remove as much anonymity from the mobile space as possible. Generally, device configurations are individualized enough to be nearly unique, and a strong indicator that a user is the same across multiple journeys. This will mitigate the damage done by synthetic ID fraudsters, business email compromises, and APP fraud.
Automation
The adoption of a fully automated fraud management platform is crucial. Not only does it cut down on human resources devoted to the fraud detection process, but automated solutions like SEON can also introduce less friction as they find more useful data that is impossible for a human counterpart to discover, at least with any time efficiency. BNPL providers that want to optimize the customer experience for minimal friction should certainly be automating their risk assessment. This way, inspecting identity attributes that aren’t obvious to the naked eye can be detected, and those determinations can then inform the overall risk score.
Education and Awareness
Employees throughout the corporate infrastructure should have regular training and awareness of the fraud scams of the day. Software cannot be installed to detect every possible instance of social engineering, low-tech as this method tends to be. From executives to entry-level staff, anyone with credentials to access sensitive internal data should know things like basic password security, including the main tenet: Don’t give your password to anyone.
AML Compliance
Financial institutions wishing to cover all their bases in terms of compliance should integrate an AML solution into their fraud prevention. Sanctions laws dictate that facilitating or participating in financial transactions with sanctioned entities will result in fines or, even worse, penalties. Complete AML compliance should also consider things like politically exposed person (PEP) list checks, adverse media screening, and processes to determine the ultimate beneficiaries of transactions.
You might also be interested in:
- SEON: 5 Common Types of Digital Banking Fraud
- SEON: Transaction Monitoring in AML: What is It & How to Set it Up