In Which Parts Of The UK And USA Is Business Fraud Most Prevalent?
Since the dawn of the digital revolution, the ways criminals have at their disposal to commit fraud against both individuals and businesses have skyrocketed, putting hard-earned money at risk and causing major consequences.
Thankfully, there are many things you can do to protect yourself and your business from their criminal intentions.
From virus protection and anti-ransomware tools to specialist fraud prevention systems, there is a digital security option for every business scenario as the technology continues to become more flexible and more affordable.
This means you can conduct business safely and securely, knowing that you’re protected from a range of commonplace digital threats like ecommerce scams and chargeback fraud.
By using some of the most innovative solutions like device fingerprinting and advanced risk scoring algorithms, you’ll be able to make business decisions with confidence going forward.
According to the Met Police, fraud encompasses any act of misrepresentation whereby a scammer lies about themselves, their actions or their services to cause a gain or loss.
The USA reports are those received by the Federal Trade Commission. The UK fraud reports we used were collected by the National Fraud Intelligence Bureau (NFIB). In both cases, each report indicates a single instance of fraud being committed against a business.
Fraud in the USA
In this section, we will focus on the fraud landscape of the United States, looking at business and overall fraud rates on a state-by-state basis. All data shown here is for the first half of 2021 (Q1 and Q2).
The USA’s Business Fraud Hotspots
These are the states with the highest rates of business fraud compared to their populations. We’ve calculated the rate per 100,000 people in order to compare states of considerably different sizes against one another. Here’s what we found.
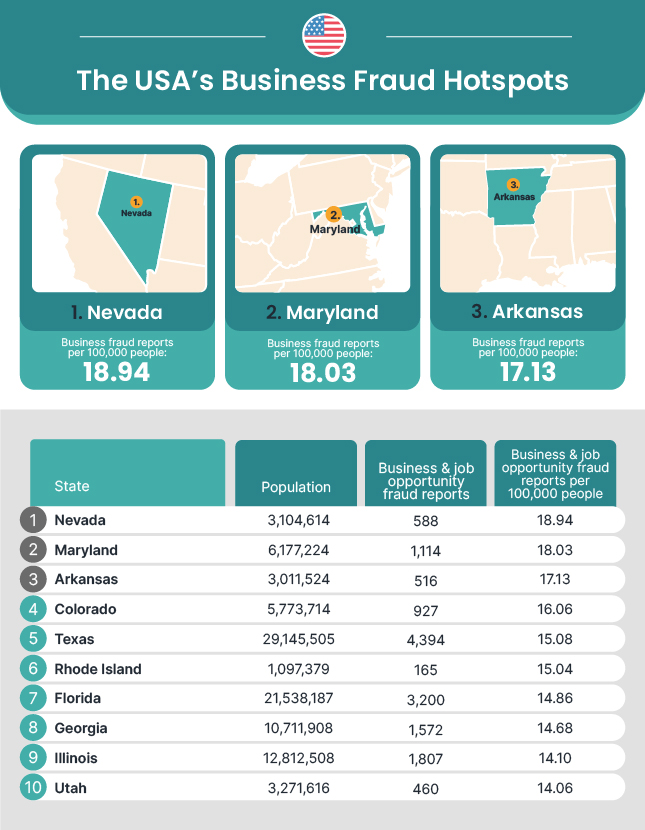
- Nevada Business Fraud Reports Per 100,000 people: 18.94
It seems that Nevada is the USA’s biggest business fraud hotspot, with 18.94 reports of business fraud per 100,000 people. This is more than 2.5 times the rate of the country’s best-performing state, Nebraska, where there were only 7.24 reports per 100,000 people. That’s a colossal difference!
- Maryland Business Fraud Reports Per 100,000 people: 18.03
Not far behind Nevada is our second-place hotspot, Maryland, which recorded 18.03 reports of business fraud per 100,000 residents. Despite having almost double the number of business fraud incidents than Nevada, Maryland’s large population puts it in second place overall.
- Arkansas Business Fraud Reports Per 100,000 people: 17.13
In third place, with 17.13 cases of business fraud per 100,000 people, is Arkansas. Despite the low total number of business fraud reports, this southern state has a much higher than average rate of business fraud when looked at on a per capita basis.
The States With the Most Overall Fraud Per Head
The figures below take into account cases of fraud committed against individuals and consumers, as well as businesses, indicating a need for personal protection against online threats.
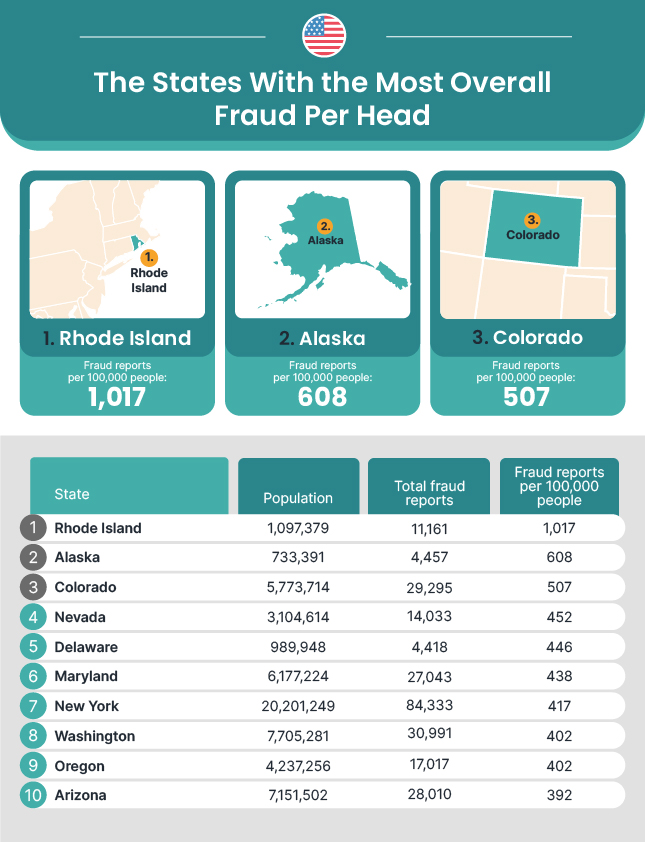
- Rhode Island Fraud Reports Per 100,000 People: 1,017
Rhode Island has the highest number of fraud reports per 100,000 people in the country, at 1,017. The Ocean State has a rate so high it is more than double that of every other state apart from the runner-up, making it an extremely risky place for fraud.
- Alaska Fraud Reports Per 100,000 People: 608
In second place, with a fraud rate of 608 cases per 100,000 people, is Alaska. This expansive northern territory may be sparsely populated, but that hasn’t saved it from the unwanted attention of fraudsters.
- Colorado Fraud Reports Per 100,000 People: 507
With almost 30,000 reported cases of fraud and a population of around 5.8 million, the state with the third-highest rate of fraud reports is Colorado, which recorded 507 cases per 100,000 people.
The States With the Highest Losses Per Reported Fraud
These states are the worst places to be hit by fraud in the USA as they have the highest average monetary loss per reported fraud case.
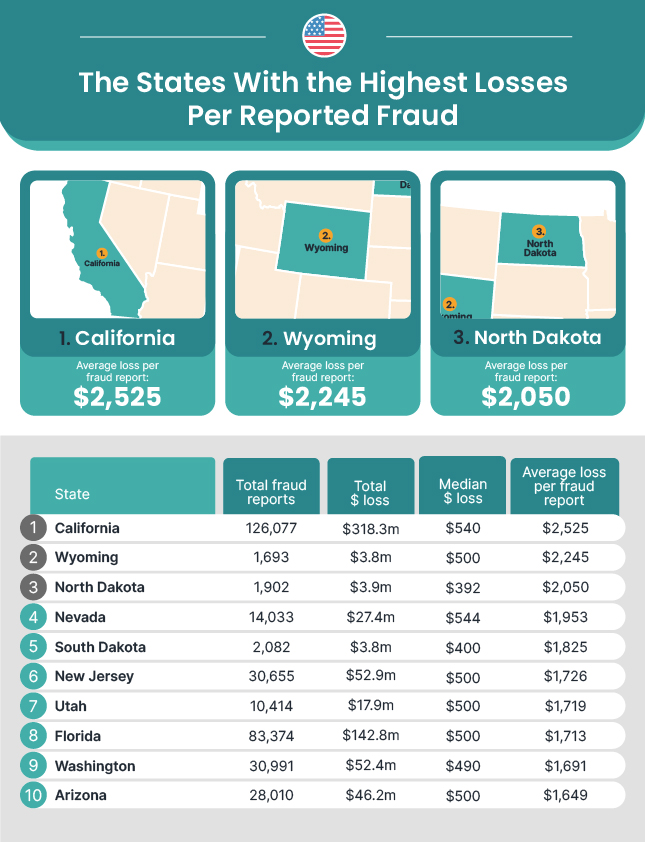
- California Average Loss Per Fraud Report: $2,525
With over 126,000 reports of fraud in the first half of 2021 and total losses of $318 million, California is the state with the highest average loss per fraud report at $2,525. As one of the planet’s biggest economies and home to the tech giants that have dominated the business world, California has become a prime target for fraudsters looking for high-value scores.
- Wyoming Average Loss Per Fraud Report: $2,245
In contrast to California, Wyoming has one of the smaller total numbers of fraud reports. However, the average cost of these fraud incidents is as much as $2,245, the second-highest in the country. With such costly incidents of fraud taking place in Wyoming, its nickname of the Cowboy State begins to take on new meaning.
- North Dakota Average Loss Per Fraud Report: $2,050
North Dakota claims third place with average losses per reported case of fraud standing at $2,050. However, the median losses in North Dakota are significantly lower than those in other states this high up the table, suggesting that the data may be skewed by a few particularly costly incidents of fraud.
Fraud in the UK
We now turn our attention across the pond, to the state of fraud in the United Kingdom. Here, we’ll take a closer look at fraud rates by comparing them by the police force area in which they were reported. We’ll look at corporate fraud rates for each area, as well as overall fraud rates, and will also calculate the average cost per fraud incident in each case.
The UK’s Business Fraud Hotspots
In this section, we will highlight the UK’s business fraud hotspots that have seen the highest rates of corporate fraud in the first half of 2021.
These rates are calculated per 100,000 residents, making each area directly comparable to one another – and even to the US states we looked at previously.
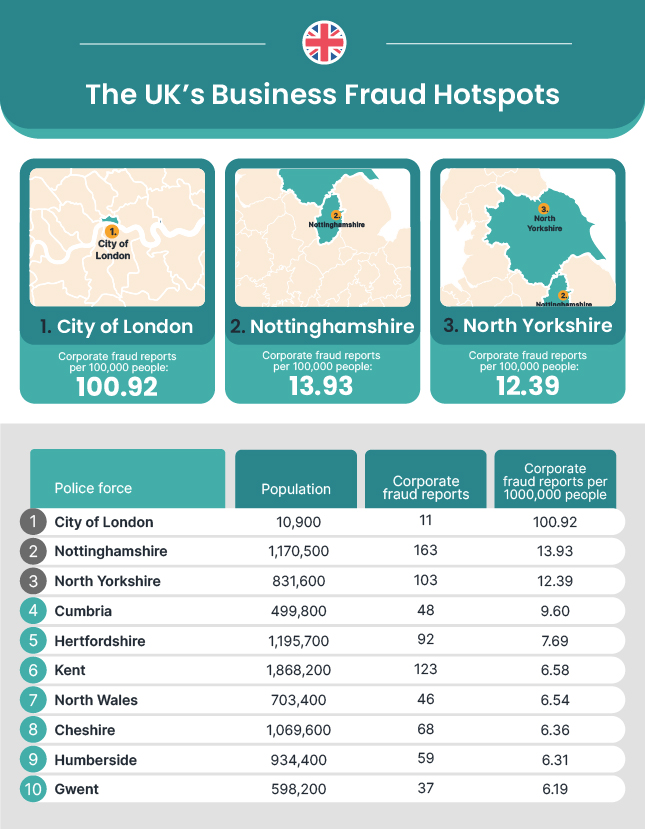
- City of London Corporate Fraud Reports Per 100,000 People: 100.92
The City of London has the highest rate of corporate fraud per 100,000 people in the country, at 100.92 cases. This will likely come as no surprise, as the City of London is the center of the UK’s financial industry and has a huge number of businesses, while also being home to a comparably small number of people.
- Nottinghamshire Corporate Fraud Reports Per 100,000 People: 13.93
Nottinghamshire has the second-highest rate of corporate fraud in the country, with 13.93 reports per 100,000 people, making the county a much riskier place to do business than the majority of the country.
- North Yorkshire Corporate Fraud Reports Per 100,000 People: 12.39
With 12.39 reports of business fraud per 100,000 people is North Yorkshire, in third place. This largely rural county is home to several well-off small cities and market towns, such as York and Harrogate, which act as business hubs for the area and are likely the focus of fraudsters’ attention in the region.
The UK Areas With the Most Costly Incidents of Business Fraud
The costs of fraud can be crippling to small businesses, and can even put larger organizations in troubled waters. With this in mind, we wanted to show how the average losses of corporate fraud vary from region to region, revealing the areas that lose the most to fraudsters on average.
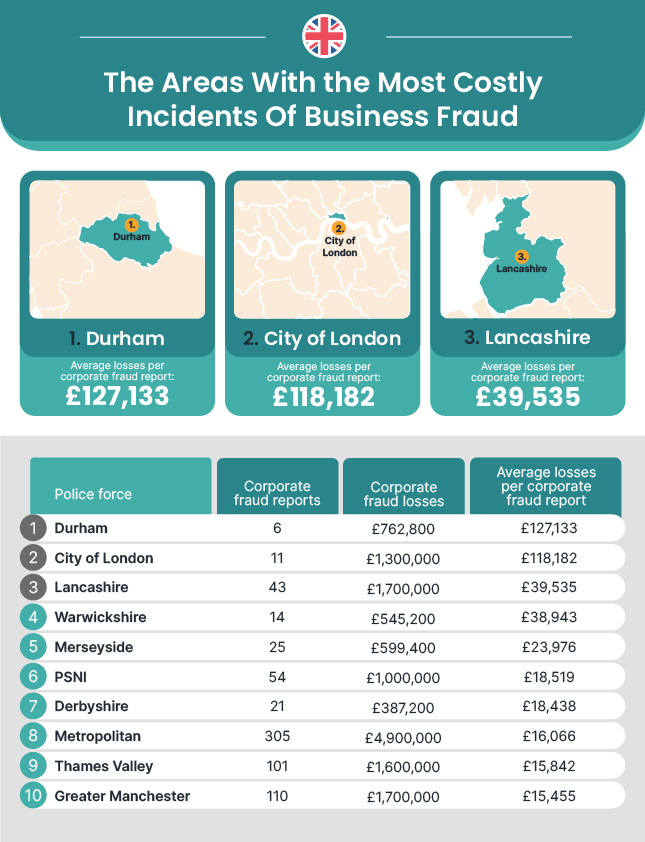
- Durham Average Losses Per Corporate Fraud Report: £127,133
County Durham, the territory policed by Durham Constabulary, has the highest average losses per report of business fraud in the country at £127,133. This huge sum is more than three times higher than every region other than second place, which it is still noticeably higher than.
- City of London Average Losses Per Corporate Fraud Report: £118,182
In second place is the City of London, which recorded average losses from corporate fraud of £118,182 per report. While still being much higher than the vast majority of other regions, it is perhaps surprising that the City of London did not top the leaderboard in this instance, given that it is home to the UK’s finance industry.
- Lancashire Average Losses Per Corporate Fraud Report: £39,535
Lancashire is the third most expensive place to be hit by business fraud, with the average losses per reported case of fraud reaching £39,535. While substantially lower than the average losses incurred in County Durham and the City of London, this figure is still high enough to put some small companies out of business altogether.
Overall Fraud Hotspots in the UK
We’ve also taken a look at rates of all types of fraud across the country. These findings will highlight the parts of the country that are most vulnerable to fraud in general.
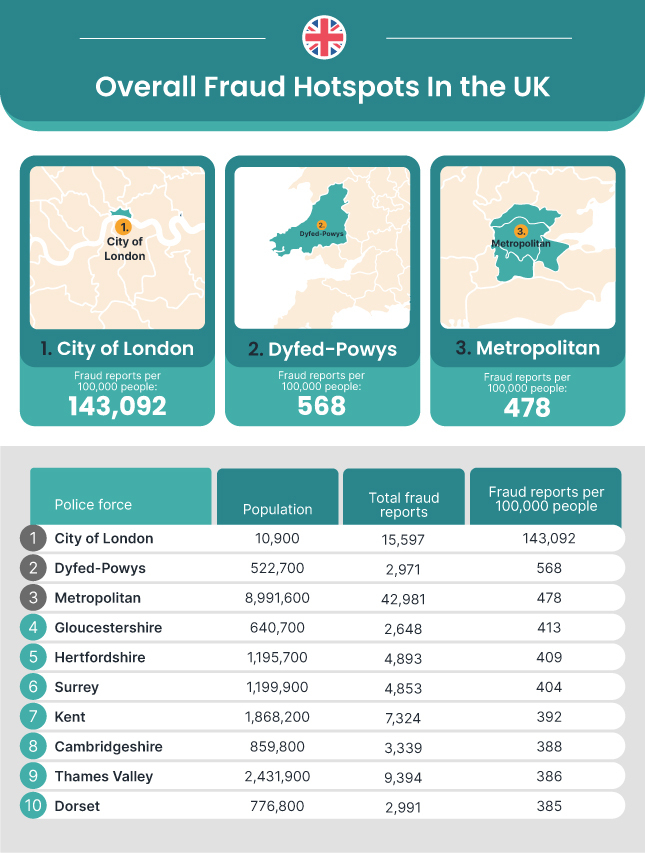
- City of London Fraud Reports Per 100,000 People: 143,092
As with corporate fraud, the City of London places top as the region most susceptible to all forms of fraud, with 143,092 reports per 100,000 people. Again, this data is skewed by the fact that the City of London is predominantly a business area as well as a busy tourist destination. Still, with more reports of fraud than people living in the area, this still adds up to a huge amount of dishonest activity targeting innocent people and organizations.
- Dyfed-Powys Fraud Reports Per 100,000 People: 568
In second place, with 568 reports of fraud per 100,000 people, is the area covered by Dyfed-Powys Police in Wales. This large, relatively sparsely populated area recorded fewer than one-fifth of the number of fraud incidents that were reported in the city of London, despite having a population almost fifty times the size.
- Metropolitan (Greater London) Fraud Reports Per 100,000 People: 478
For third place, we return to London, with the Metropolitan Police recording a whopping 42,981 incidents of fraud in the first half of 2021. When measured against the population of this area, though, the rate per 100,000 people is reduced to a less shocking 478.
The Areas With the Most Costly Fraud Incidents
Lastly, we wanted to find out the average cost of all fraud incidents in each area. This will allow us to compare the cost of business fraud in each area with the overall average, while also highlighting the parts of the country where fraudsters make the most money.
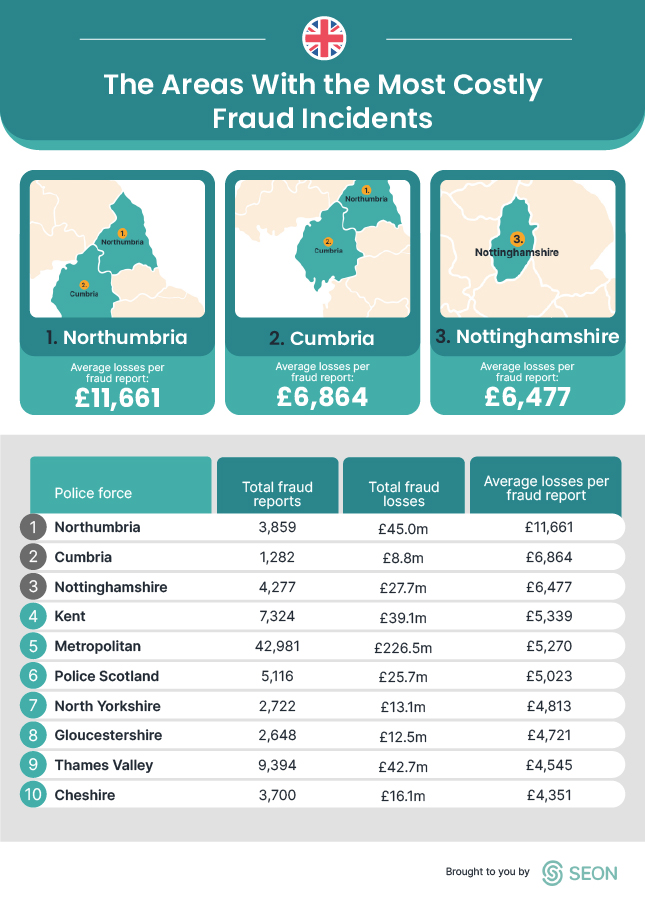
- Northumbria Average Losses Per Fraud Report: £11,661
Northumbria tops the list as the most expensive part of the UK to fall victim to any type of fraud, with average losses per incident standing at £11,661. This is almost double the average amount recorded in any other area.
- Cumbria Average Losses Per Fraud Report: £6,864
In second place is Cumbria, in which the average losses incurred from a single incident of fraud stands at £6,864 on average. Cumbria borders first-place Northumbria in the far north of England, making this particular part of the country stand out as a lucrative target for fraudsters.
- Nottinghamshire Average Losses Per Fraud Report: £6,477
In third place, with average losses per fraud report of £6,477, is Nottinghamshire. This Midlands county recorded total fraud losses of £27.7 million in the first six months of 2021, almost catapulting into second place.
Methodology
We wanted to reach conclusions about which parts of the UK and USA had the highest rates of business fraud, as well as which areas had the most costly business fraud. To find this out we used data from the Federal Trade Commission for the USA and data from Action Fraud for the UK.
For each country, we recorded both the total number of fraud reports in each state (USA) or police force area (UK), as well as the total number of business or corporate fraud cases. We then compared this to population data from ONS, National Records of Scotland, and NISRA for the UK, and population data from Census.gov for the USA. This gave us relative rates of fraud and business fraud in each geographical area, allowing us to compare them to one another while taking into account differences in population size.
We also looked at the average cost of fraud and business fraud in both countries, using data from the aforementioned sources. We calculated the average cost per fraud report and used this to rank the states and police areas accordingly.